
Ad Insights organizes performance into four tabs. Here’s what Channels, Ads, Media, and Attributes each show you.
Where to find it: Left menu → Analyze → Ad Insights. Part of the Ad Insights guide.
The four tabs
Ad Insights is split into four tabs. Each one answers a different question about your ads.
| Tab | What it shows |
|---|---|
| Channels | How each connected ad account (LinkedIn, Facebook, TikTok, and more) is performing, plus your overall totals. |
| Ads | Every individual ad, with its creative preview and its own numbers. |
| Media | Your ad images and videos, and how each asset is performing. |
| Attributes | The visual styles the AI finds inside your creative, and which ones drive clicks. |
Channels
The Channels tab starts with your top-line numbers across all accounts:
- Total Spend — how much you spent in total.
- Impressions — how many times your ads were shown.
- Clicks — how many times people clicked.
- Conversions — how many desired actions were completed.
- Blended ROAS — return on ad spend across all channels combined.
- Avg CPA — your average cost for one conversion.
Below the totals, there’s a card for each connected ad account. Each card shows that account’s Spend, ROAS, Conversions, CPA, impressions, and CTR, along with a status like Active. A counter tells you how many channels are active right now.
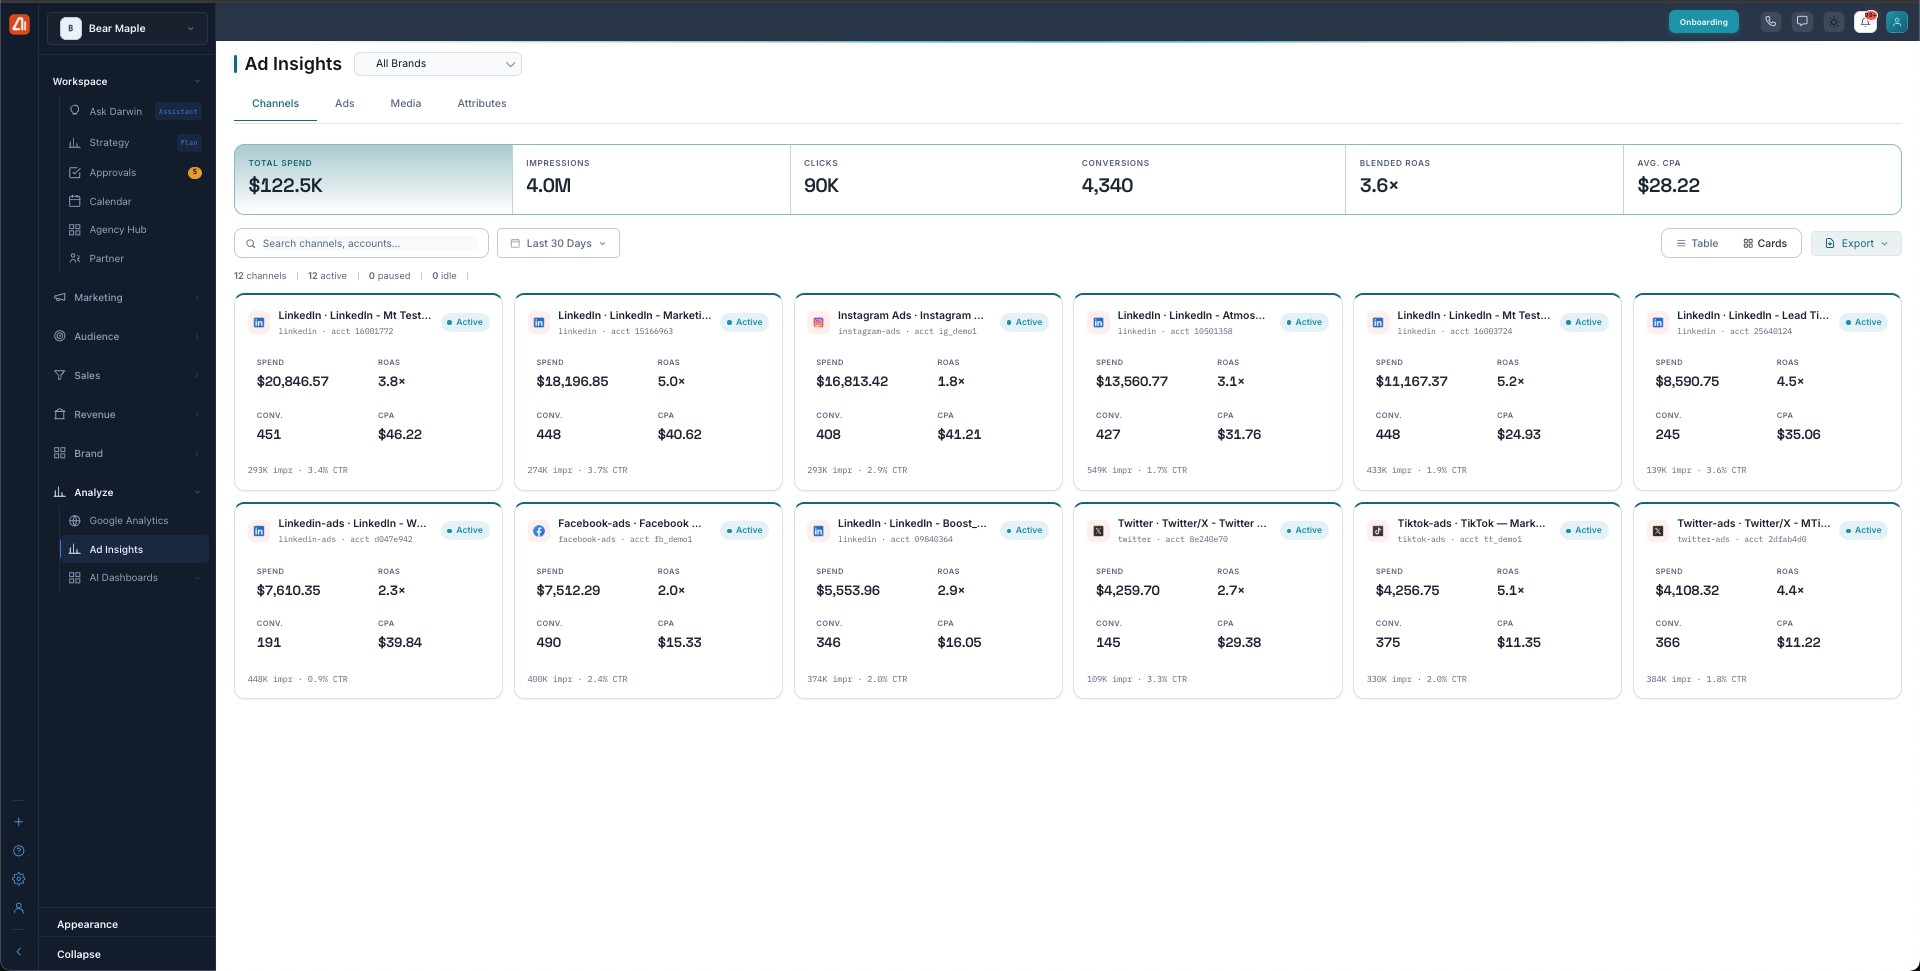
Each connected account gets its own card with spend, ROAS, conversions, and more.
Ads
The Ads tab lists every individual ad. Each ad appears as a card that shows the creative preview, the ad name, and the platform it ran on. On each card you’ll see the ad’s CPC (cost per click), impressions, CTR (click-through rate), and spend. There’s a Filter, a Search, and a count of how many ads were found.
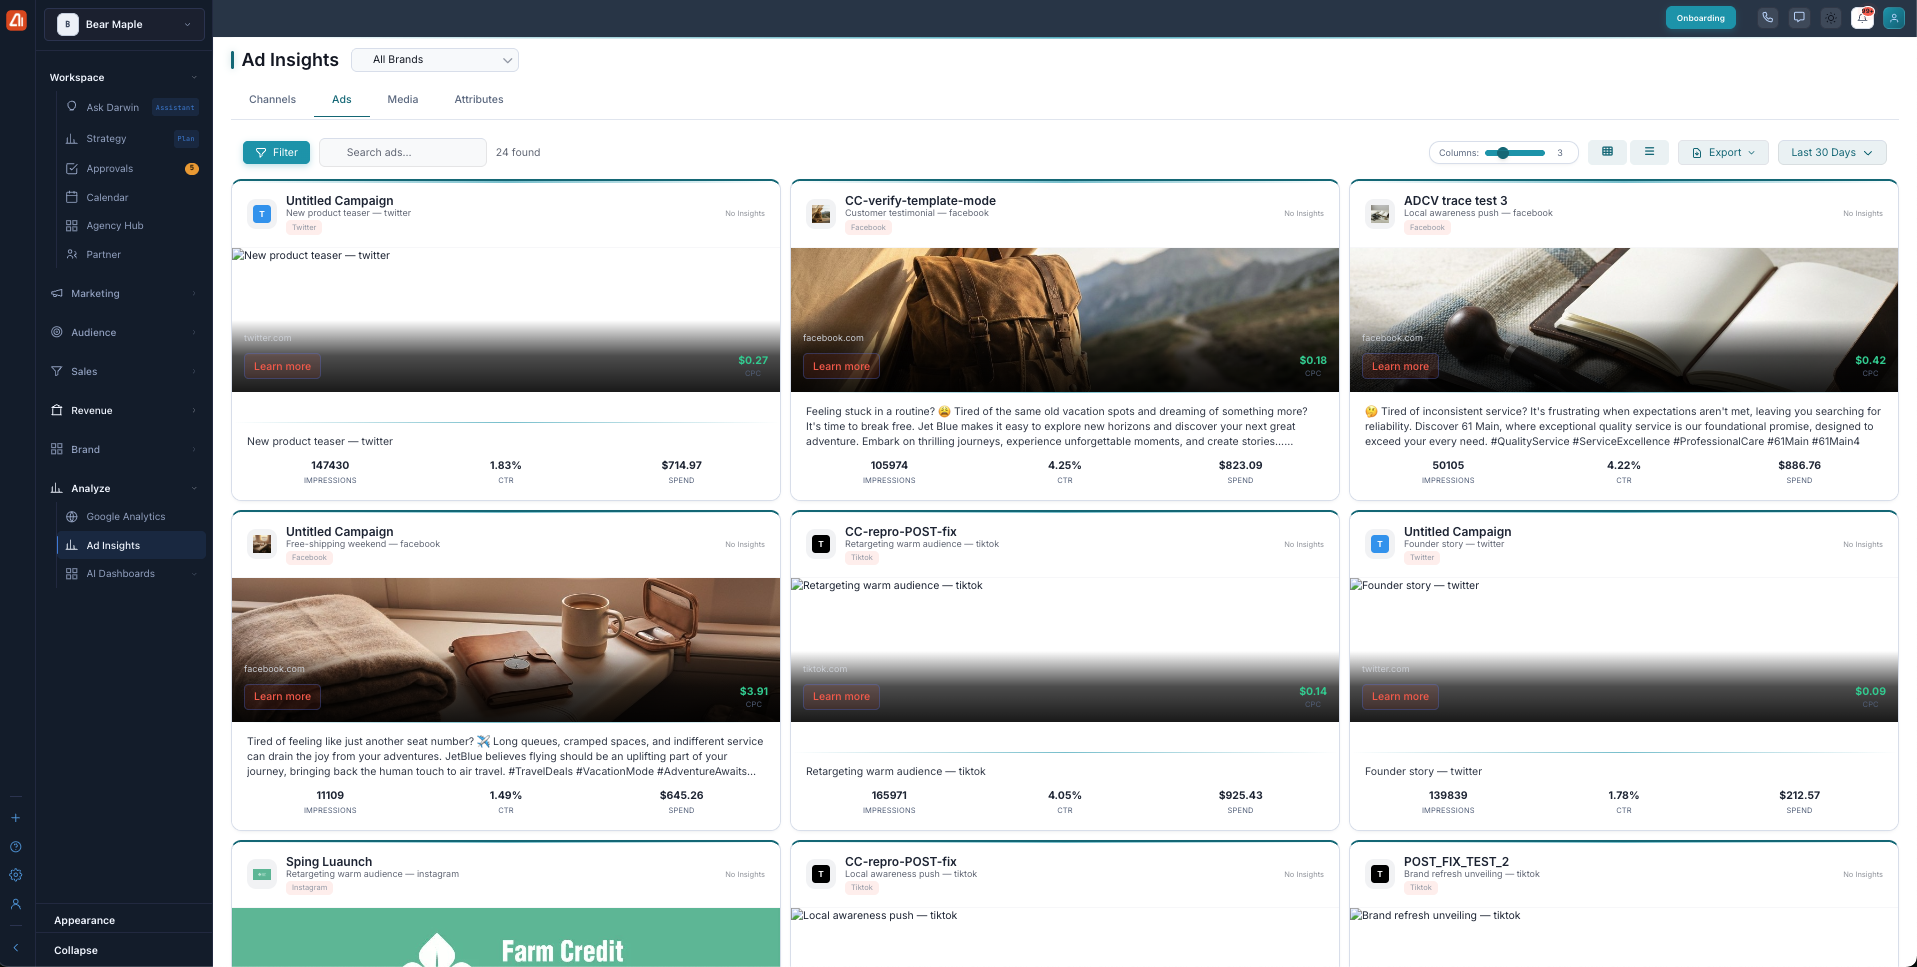
Every ad is a card with its creative preview and key numbers.
Media
The Media tab is about your ad media — the images and videos themselves. Each asset appears as a card showing the image or video, its type, and its Impressions, Clicks, and CTR. Each card also has tags that describe the asset, like Urban, Industrial, or Neutral, so you can spot patterns in what you run.
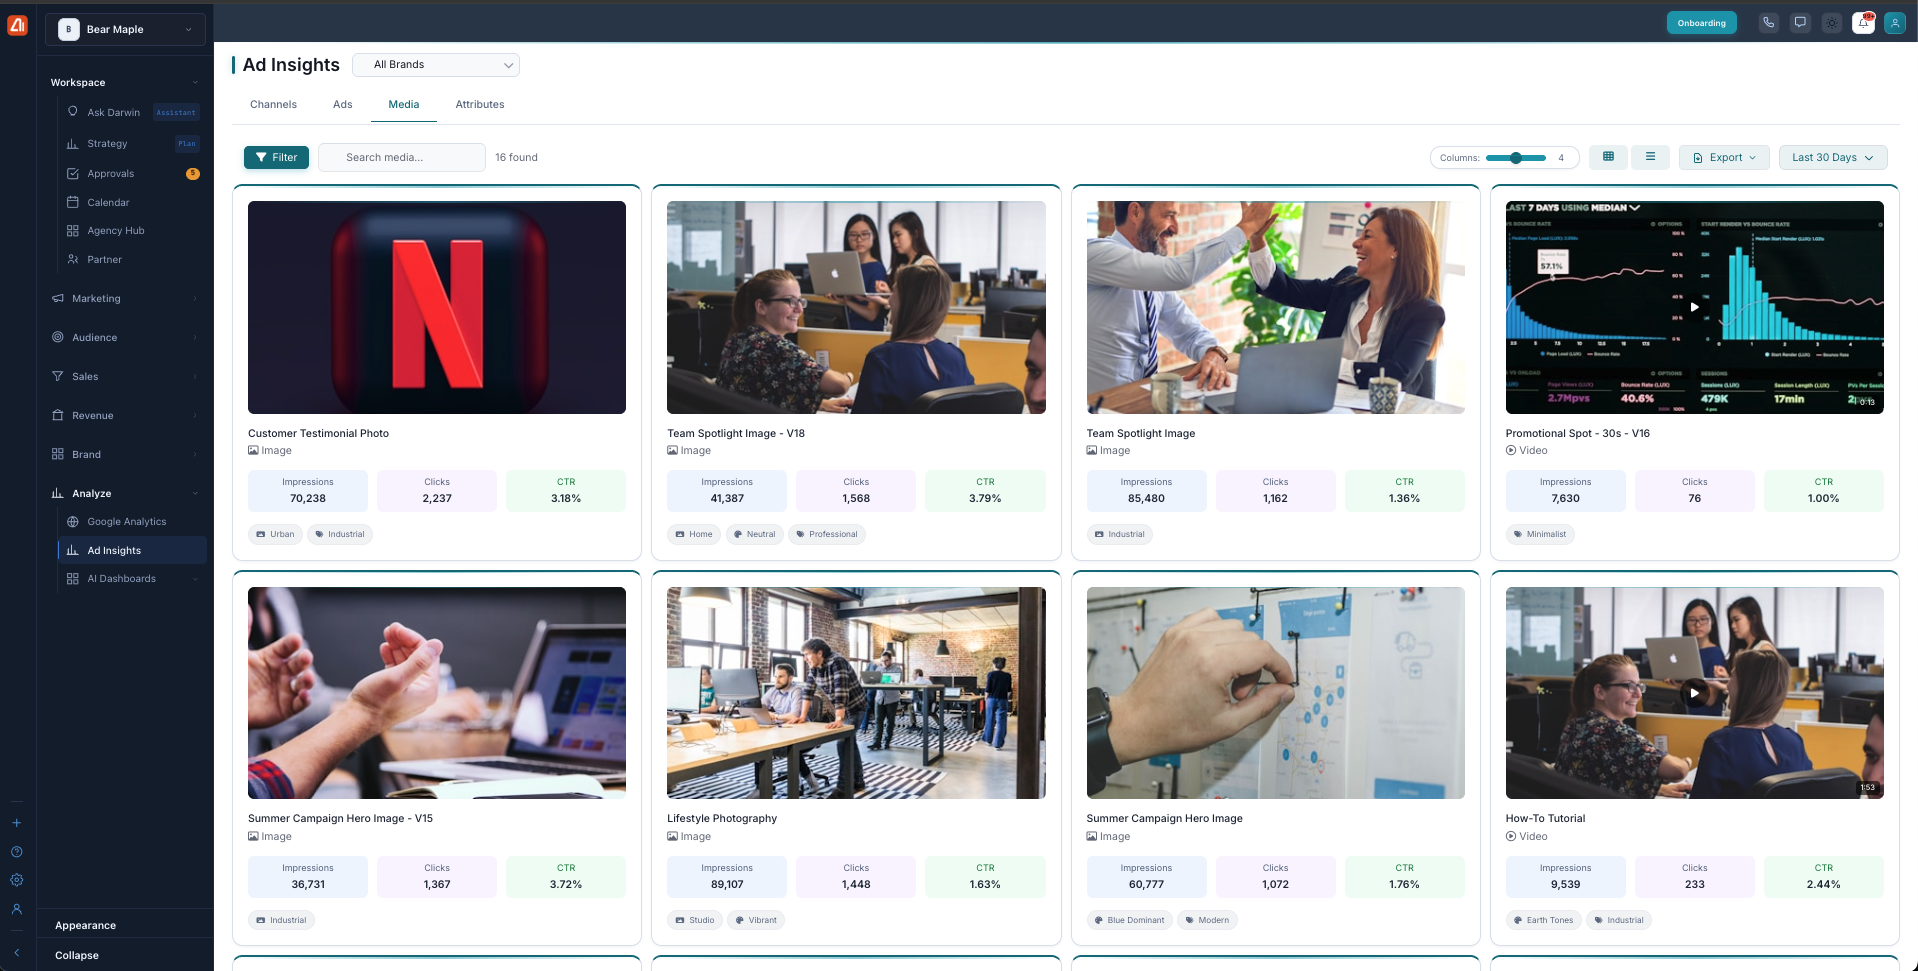
See how each image and video performs, with tags that describe it.
Attributes
The Attributes tab is where the AI really shines. It looks at what is actually in your creative and groups it into attributes — things like No People, Diverse Group, Laptop, Centered, Industrial, Low Key, Neutral, Vibrant, and High Contrast. These are sorted into categories such as Person, Object, Composition, Scene, Lighting, Color, and Style.
Each attribute shows how many media assets have it, plus its impressions, CTR, and spend, with a View details link. This tells you which visual styles actually drive clicks — so you can make more of what works and less of what doesn’t.
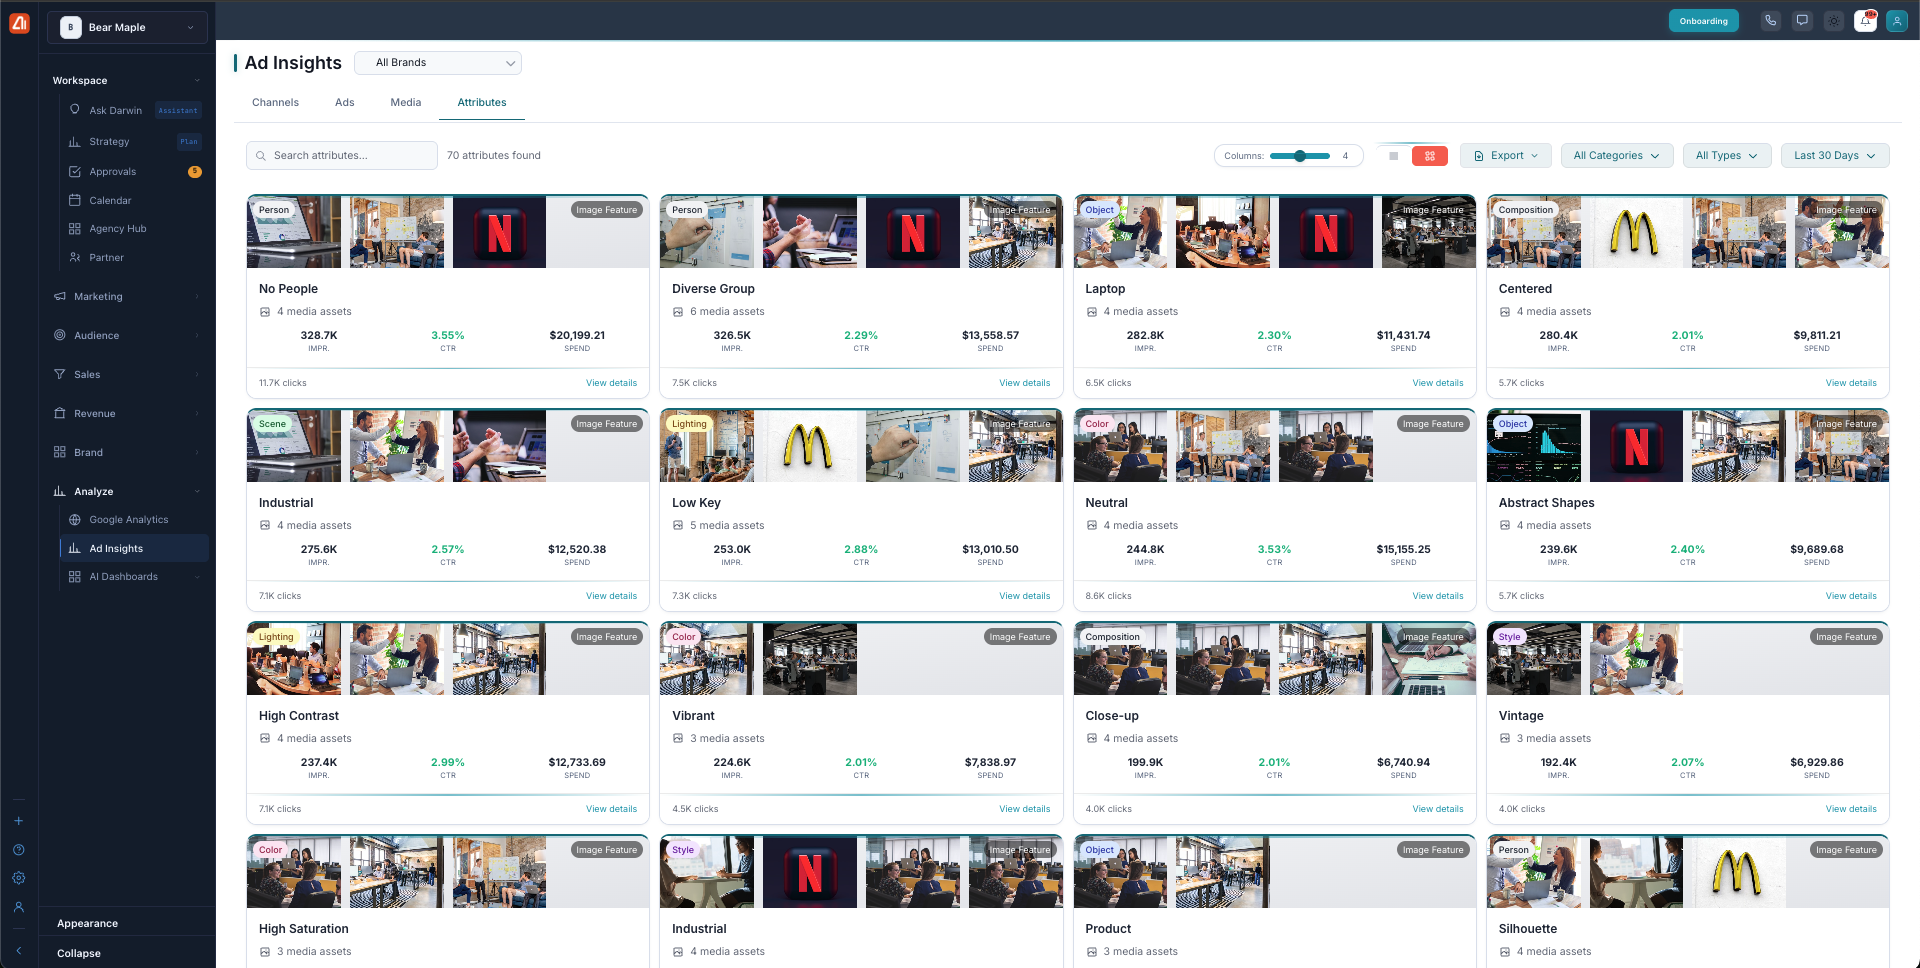
The AI groups your creative by visual style so you can see what drives clicks.
What’s next
- Back to the Ad Insights overview.
- See Channel & Campaign Detail.
- See Metrics Explained.