
The Overview tab is the first thing you see in Agency Hub, and it’s built to answer one question: where do I need to focus right now? It’s your executive dashboard — real-time insight across every client and campaign, worst-first — so you act before a client churns instead of after.
Where to find it: Left menu → Agency Hub → Overview tab (it opens here by default). Part of the Agency Hub suite.
The “This week” panel
At the top, a This week panel puts what needs attention first. It reads live from billing, trials, and activity and calls out the client most at risk — so the dashboard tells you who to call, not just how things are going.
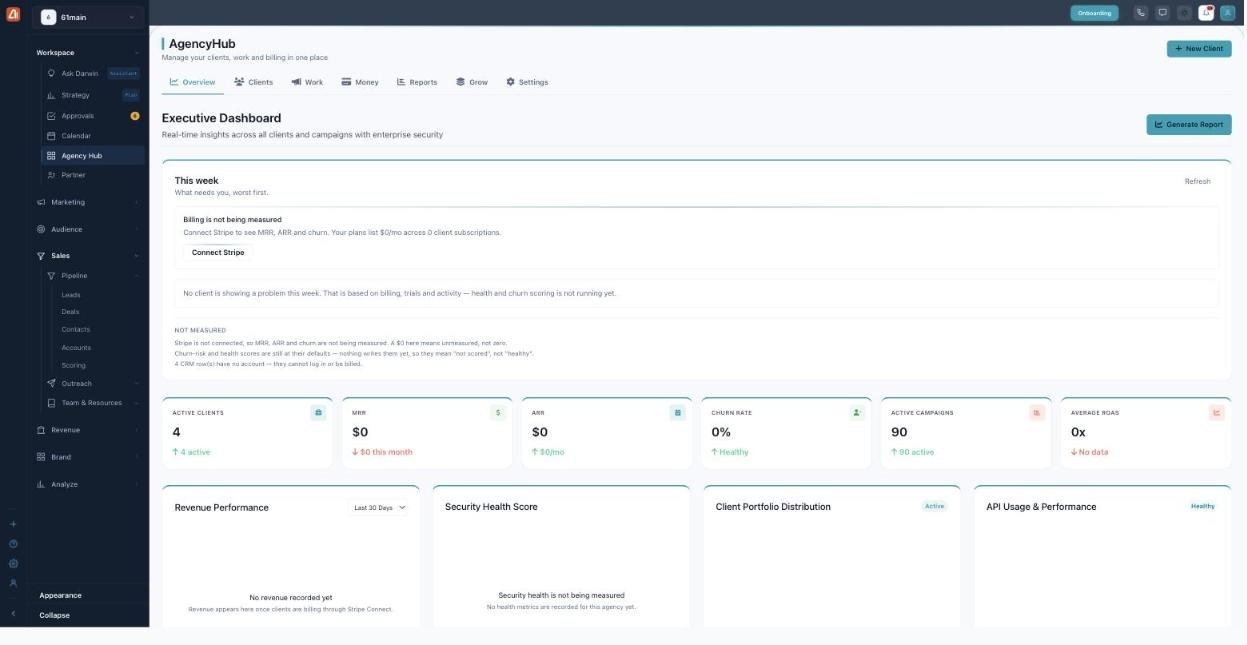
The Overview dashboard — This week, six stat cards, and four live charts.
The six stat cards
Across the middle, six cards summarize the whole agency at a glance:
| Card | What it shows |
|---|---|
| Active Clients | How many clients are currently live (a true count across your own and linked sub-accounts). |
| MRR | Monthly recurring revenue across all client subscriptions, pulled from Stripe. |
| ARR | Annual recurring revenue (MRR × 12 when not supplied directly). |
| Churn Rate | The share of clients leaving — labeled Healthy at 5% or below, Needs attention above it. |
| Active Campaigns | Total campaigns running across every client. |
| Average ROAS | Return on ad spend across the whole portfolio, shown as a multiple (e.g. 3x). |
The four charts & recent projects
Below the cards, four charts go deeper: Revenue Performance (with a selectable date range), Security Health Score, Client Portfolio Distribution, and API Usage & Performance. Scroll a little further and a Recent Projects table lists your latest campaigns — each with its type, client, brand, channel details, status, and a View link — a quick pulse on what your team shipped most recently.
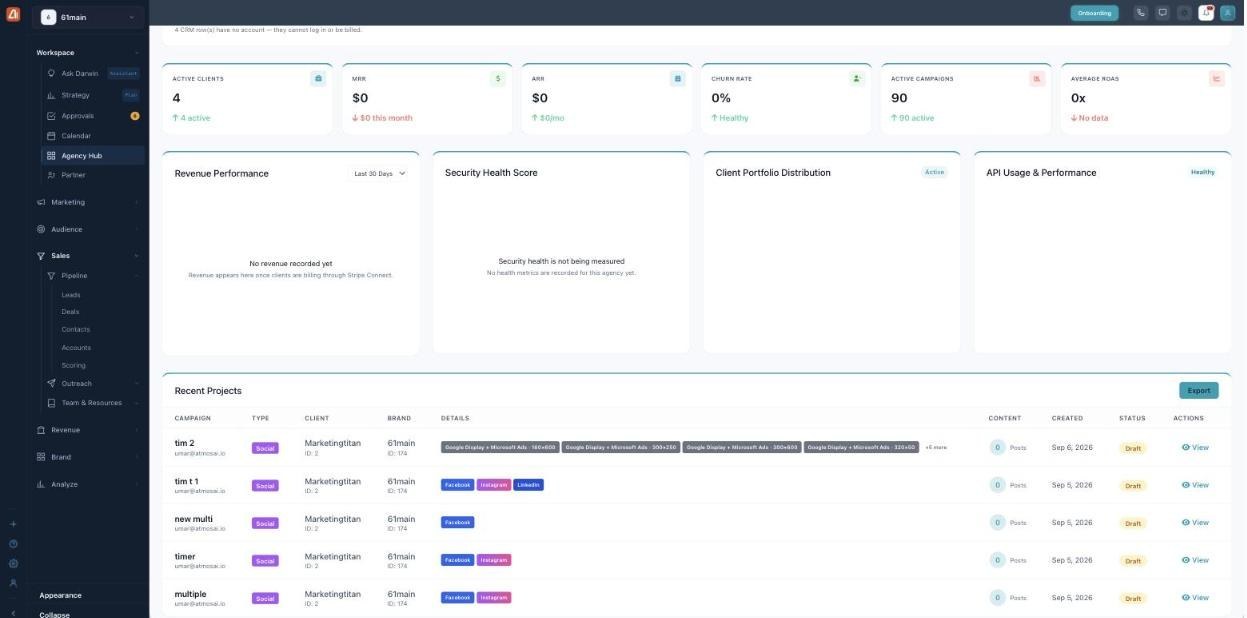
Further down: the live charts and the Recent Projects table.
Generate a report in one click
A Generate Report button in the top corner turns the whole picture into a shareable, client-ready report — pick the report type (like an Executive Summary) and toggle which sections to include (revenue, campaigns, portfolio, team, security, API), and the platform builds a branded PDF for you. There’s also an Export Data option for a raw download.
Honest numbers, by design
Agency Hub never fabricates metrics. Anything it can’t measure yet — security uptime before monitoring is set up, revenue before Stripe is connected — is shown as “not measured,” not as a fake number. So a
$0on MRR means “connect Stripe to start measuring,” not “you earned nothing.”
Billing numbers — MRR, ARR, and churn — only fill in once you Connect Stripe (Settings → Stripe Connect). Until then you’ll see a Connect Stripe prompt right inside the This week panel.
Common questions
Why do MRR, ARR, and churn show $0?
They come from billing, which only flows in after you connect Stripe. A $0 means “not measured yet.”
What counts as “Healthy” churn?
A churn rate of 5% or below is labeled Healthy; above that it’s Needs attention.
Can I share this dashboard with a client?
Use Generate Report to turn it into a branded PDF you can send — you choose exactly which sections to include.
If the charts look empty, connect Stripe (for revenue) and make sure campaigns are running — the dashboard reflects real activity from the last 30 days.