
The Overview tab is the executive summary of your brand’s health — one screen that answers “how strong is this brand, and what’s holding it back?” It opens by default when you launch Brand Analysis.
Where to find it: Brand → a brand → Brand Analysis → Overview. Part of the Brand Analysis guide.
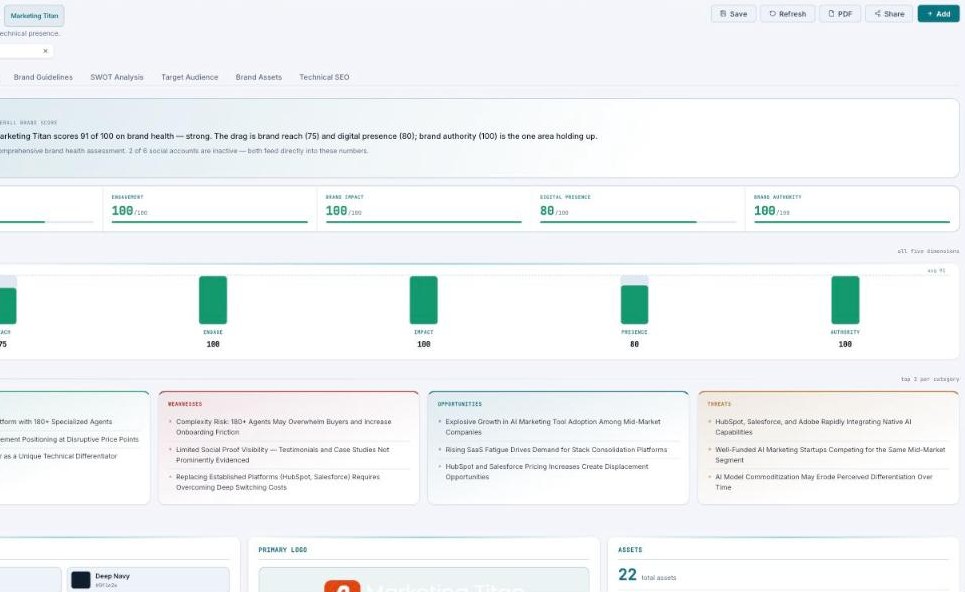
The Overview — score, the five metrics, a performance chart, and a SWOT preview.
The brand-health score
A large score out of 100 sits at the top, with a letter grade, a position label (Strong 85+, Moderate 70–84, Weak below 70), and a plain-English sentence explaining what’s strong and what’s weak — for example, “scores 91 on brand health — strong. The drag is brand reach and digital presence.”
The five metrics
Below the score, five sub-scores each show out of 100 with a colored bar, and a Brand performance chart plots them together:
| Metric | What it measures |
|---|---|
| Brand Reach | How far your brand’s presence extends. |
| Engagement | How much your audience interacts. |
| Brand Impact | The strength of your brand’s impression. |
| Digital Presence | Your footprint across the web and social. |
| Brand Authority | How credible and established you appear. |
Everything else on the Overview
Scroll down and the Overview pulls the highlights from every other tab into one place:
- SWOT preview — the top three Strengths, Weaknesses, Opportunities, and Threats (the full set is on the SWOT tab).
- Identity summary — your colors and type, primary logo with a confidence score, and an assets count (products, services, features, logos).
- Audience & technical — demographics (age, gender, income), top personas, and technical scores (performance, SEO, mobile-friendly, security).
- Social accounts — which platforms are connected, active or inactive, with Connect/Edit/View.
- Footer & compliance — your Privacy Policy and Email Preferences URLs (“N of 2 set”), editable inline.
- Company overview — employees, founded, location, industry, and expertise (“N of 5 set”).
The Overview is a map, not a dead end
Everything summarized here links out to the tab that owns it, so the Overview is where you decide what to work on — then jump straight to the right tab to fix it.
Common questions
What counts as a good score?
85+ is Strong, 70–84 Moderate, below 70 Weak.
Why is a metric low?
Open the tab it comes from — the metric bars point you at the weakest dimension, and each tab explains the specifics.
What’s next
- Approve your Brand Identity.
- Read the full SWOT Analysis.
- Fix issues in Technical SEO.
- Back to the Brand Analysis overview.